A financial report is s formal system. That formal system is described by a formal language. That formal language has been proven by examining
about 7,000 XBRL-based public company financial reports submitted to the U.S. Securities and Exchange Commission. That language is documented for humans in
the Financial Report Semantics and Dynamics Theory. This
information is documented in machine-readable form by the Financial Report Ontology. This XBRL taxonomy schema documents this
information in machine-readable form. Below is a list of the high-level pieces of a financial report:
Topics
One of the notions of a financial report is the 'topic'. The Accounting Standards Codification (ASC) organizes the disclosures in to
a set of useful topics. I have borrowed that notion, modified it slightly to create an improved and complete set of topics (i.e. the ASC is incomplete, for example many common practices are not covered), and have represented those topics
in machine-readable form using this XBRL Taxonomy Schema: topics.xsd. Below is a human-readable list of those topics organized into a
useful hierarchy.
Disclosures
Another notion of a financial report is the 'disclosure'. A disclosure, as used here, is simply a meaningful fragment of a financial report. Every financial report is simply a set of fragments,
or a set of disclosures. The Accounting Standards Codification organizes the disclosures that they require into the set of topics mentioned earlier. But the Accounting Standards Codification simply describes
what needs to be disclosed and perhaps here and there provides an example. I gave each disclosure a unique name. This XBRL taxonomy schema
articulates that list of disclosure names in a flat list. This XBRL definition linkbase arranges the named disclosures by topic. Below is a list
of named disclosures organized by topic in human readable form. This Disclosure Viewer is another organziation
of those same disclosures.
Reporting Styles (also called report frames or reporting palettes)
Not all public companies report all information in exactly the same way. For example, a bank such as Bank of America does not report the same as a software company such as Microsoft. Further, economic entities
have some flexibility in, for example, whether they report gross profit (i.e. multi-step income statement) or not (i.e. single-step income statement). And so, economic entities use different styles of reporting.
A list of the different reporting styles and how many public companies use that style is provided below. I don't have a good list of reporting styles (which I call report frame codes) at this point.
This Reporting Style Viewer is another organziation of these reporting styles.
This is yet another way to look at reporting styles of public companies.
Fundamental Accounting Concepts
Each reporting style is basically a way specific line items of a financial report is organized within a financial report. The fundamantal accounting concepts is simply an identification of these basic
concepts and how these basic high-level concepts are organized within a financial report. This Crash Course in the Fundamental Accounting Concepts
walks you through the notion of the fundamental accounting concepts in detail. Below is a list of the basic, fundamental accounting concepts. See the reporting styles tab for the different ways these fundamental
accounting concepts are organized within financial reports.
Key Ratios
Reported financial information is related to other reported financial information many times. The notion of 'key ratio' is used to represent those sorts of financial concept relations.
This XBRL taxonomy schema represents the key rations in machine-readable form. Below is a list of key ratios in human readable form:
Relationships
Things in a financial report can be related to other things in specific ways. Two common ways is the 'type-of' relation and another is the 'whole-part' relation. Other types of mathematical relations exist,
but I won't go into that here. A 'type-of' relation describes some list but the list does not add up mathmatically; it just documents that there is some sort of relation. A 'whole-part' relations is where something
composed exactly of their parts and nothing else or more where the parts add up to the whole. Another term for 'type-of' is 'class-subclass'. This list of classes.
will give you a general idea of what a class is. The FASB defines some of these classes of concepts in CON 6 but does not provide a complete
list of classes/subclasses or whole/part relations. This is a human readable list of some classes of concepts in a financial report. This resource describes
other sorts of relation types. This XBRL taxonomy schema and this XBRL taxonomy schema show how
you can represent different types of relations in machine readable form.
There is a difference between a dictionary, a taxonomy, and an ontology. This describes the differences.
The US GAAP Financial Reporting Taxonomy is really a light-weight ontology because it provides more than just a set of hierarchies. While the taxonomy does not have to document all important relations, but two things
happen when important relations are not explicitly documented: (1) errors creep into the US GAAP Financial Reporting XBRL Taxonomy and (2) people using the taxonomy do so inconsistently and incorrectly. This is
a partial list of the US GAAP Financial Reporting XBRL taxonomy. This is the taxonomy in machine-readable form.
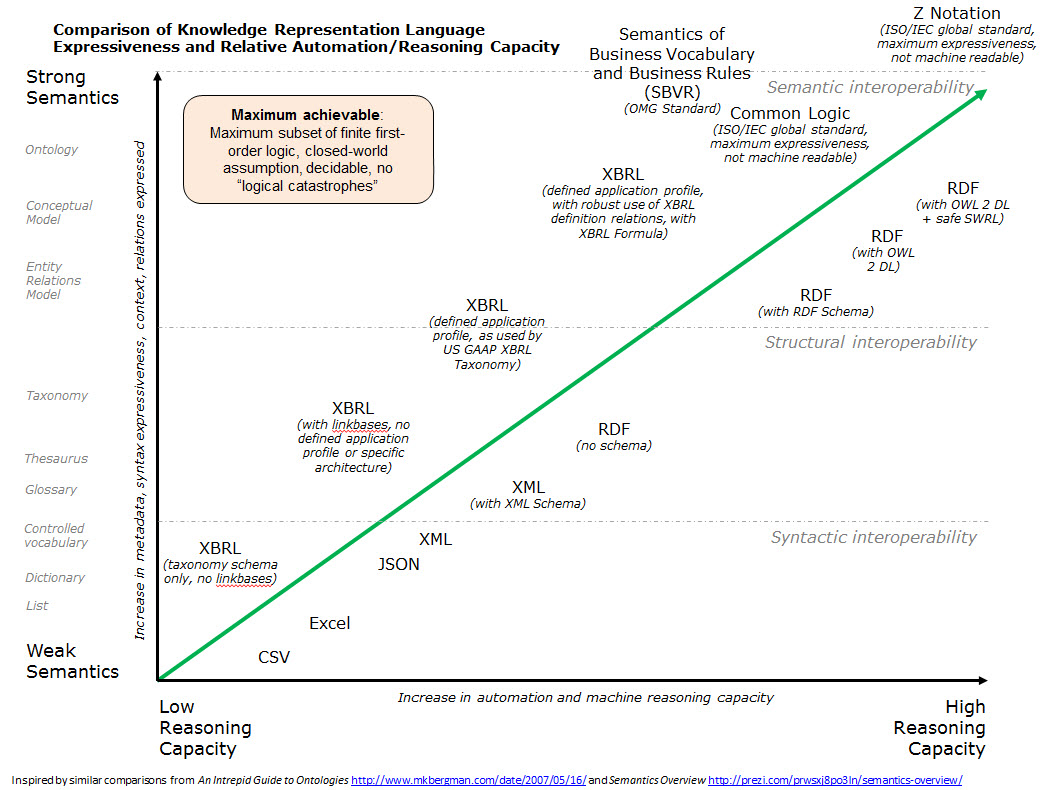
Expressive Power
There is a direct relationship between the expressive power of a language and the ability to get a machine to do work. Of course not only do you need an expressive language, such as XBRL; but you also
need to express the needed metadata in a form which is readable by both humans and by the machines that will be doing the work. The graphic below shows the relative expressive power of certain technical syntax.